In-app analytics for onboarding turns events, funnels, segments, and user feedback into decisions about the path from signup to first value.
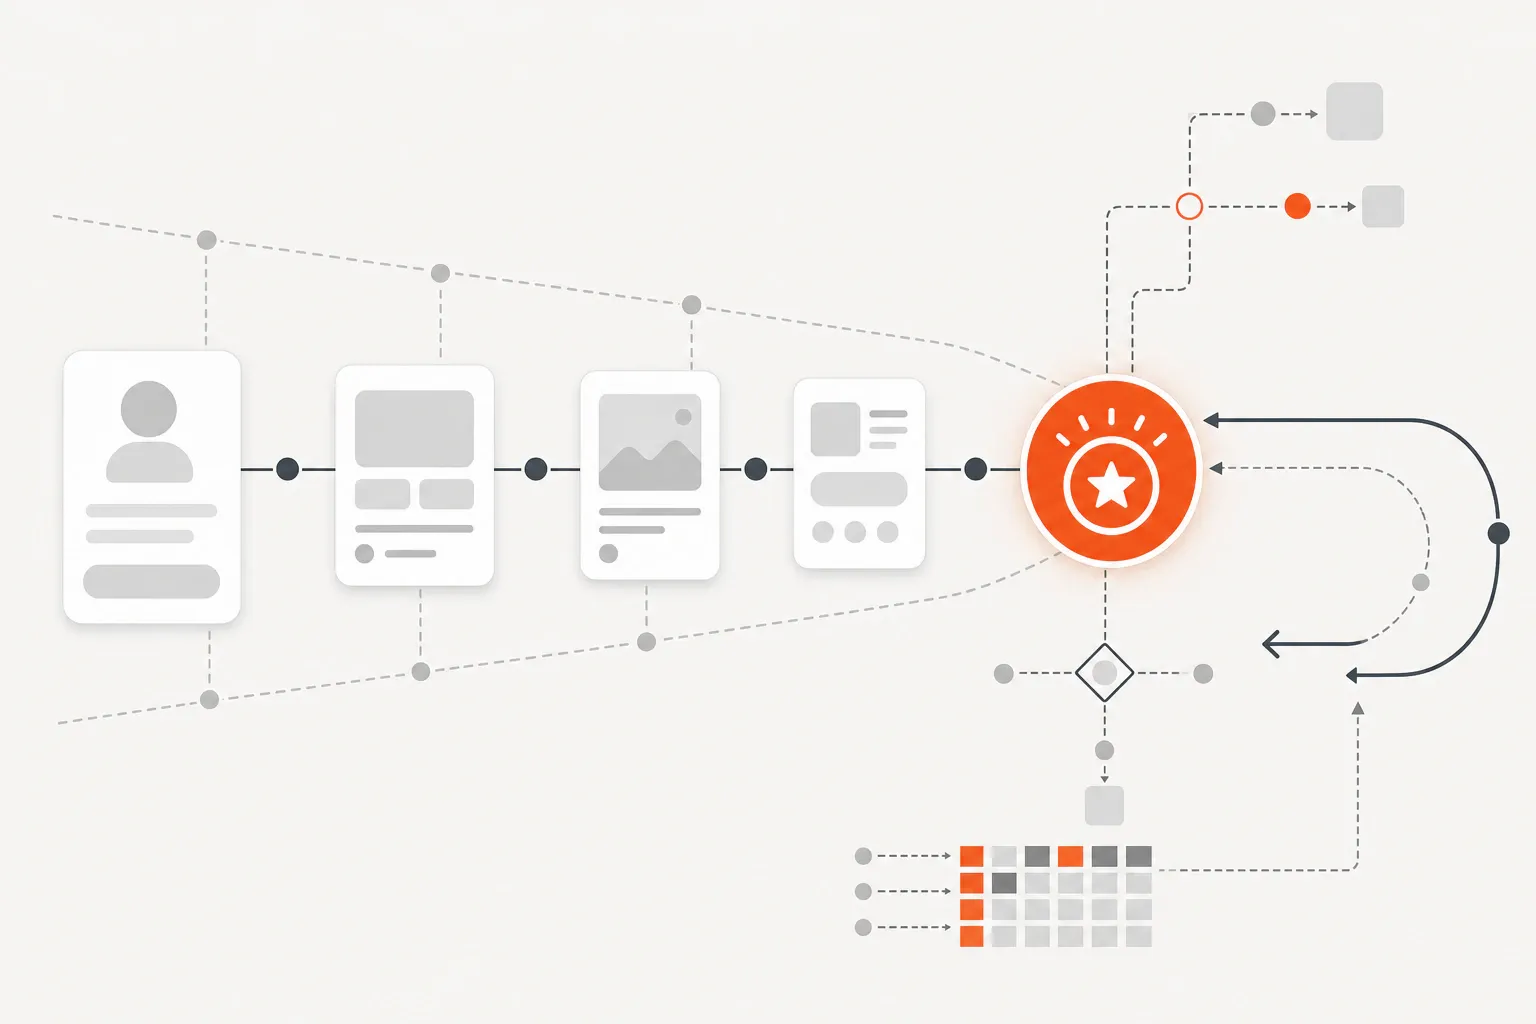
TL;DR: In-app analytics for onboarding measures how new users move from entry to first meaningful value inside a product. For a lean setup, define one activation event, three to five supporting onboarding events, and one weekly review question. Track activation, elapsed time, consequential drop-off, and meaningful return behavior by segment, then change one part of the journey at a time.
In-app analytics for onboarding is a decision system for measuring how new users reach value inside a product. For founders and product operators without a dedicated analytics team, the useful output is a small, trustworthy event plan that identifies the next onboarding change—not another dashboard.
In-app analytics for onboarding is the collection and analysis of behavioral events generated as new users move from entry to an activation event. A workspace product might record account creation, goal selection, data connection, first useful output, and a later meaningful return.
Mixpanel's event documentation defines events as product actions linked to a user and timestamp, with optional properties that add context. Funnels measure movement between those events; segments and cohorts show which users followed different paths.
The scope is narrower than marketing attribution or established-account health reporting. It concentrates on early product behavior and the evidence needed to evaluate onboarding.
Analytics also differs from in-app guidance. Analytics observes behavior; guidance changes the experience through prompts, checklists, walkthroughs, or contextual help.
Concept | Primary job | Typical output |
|---|---|---|
Onboarding analytics | Interpret early user behavior | Events, funnels, intervals, segments |
In-app guidance | Help users complete tasks | Prompts, checklists, walkthroughs |
Marketing attribution | Explain where users came from | Source, campaign, channel |
Customer-health reporting | Monitor established accounts | Adoption, engagement, risk |
Onboarding analytics matters because procedural progress can hide a value problem. A user may finish setup without completing the action the product is meant to enable.
The Appcues 2026 onboarding metrics guide defines activation around a predefined value-linked action within a set window. That makes tour completion, page views, and login counts supporting evidence rather than automatic proof of success.
A funnel can show where behavior changes, but it cannot explain the cause by itself. If the team still needs to design the journey, use the first-value onboarding foundations; the measurement work begins once the event definitions are specific enough to test.
Start with activation rate, time to first value, consequential step drop-off, onboarding completion, early retention, and one qualitative friction signal. Each metric should answer a product decision.
Activation rate is activated new users ÷ eligible new users × 100. Appcues' 2026 guide uses the same formula, while its time-to-value guide defines TTV as the interval from signup to the first meaningful benefit.
Metric | What it answers | Weak proxy | Founder action |
|---|---|---|---|
Activation rate | Do users reach the value event within the window? | Signup or login | Recheck the event or remove friction before it |
Time to first value | How long does successful progress take? | Time spent in the app | Inspect slow transitions |
Step drop-off | Where does required progress break? | Treating every exit as failure | Prioritize the stall that blocks value |
Completion | Can users finish the designed flow? | Assuming completion equals value | Compare with activation and return |
Early retention | Do activated users repeat a meaningful action? | Any later login | Validate the return event and window |
Friction signal | Why might the behavior occur? | One isolated complaint | Confirm a pattern before changing the flow |
Choose activation and retention windows from expected product use. Amplitude's usage-interval documentation notes that some products support daily use while others have much longer natural intervals.
In-app onboarding analytics works as a loop: define the outcome, instrument the path, segment the evidence, investigate friction, change one thing, and review the next cohort.
Use one activation event, three to five supporting onboarding events, and one weekly review question: Which transition is keeping the largest number of qualified users from activation, and what one change will I make next? Mixpanel's tracking-plan guidance recommends prioritizing critical data because tracking every action creates unused data and unnecessary development work.
Stage | Example event | Useful properties |
|---|---|---|
Entry | Account created | Source, device |
Context | Goal selected | Goal, role |
Setup | Data connected | Method, error state |
Activation | First useful output created | Output type, branch |
Return | Meaningful action repeated | Days since activation |
Properties keep the taxonomy small. One first_useful_output_created event can carry role, goal, source, device, and branch properties instead of becoming five separate events.
Measure conversion and elapsed time between adjacent events, then judge each stall by proximity to activation, affected segment, evidence quality, and fixability. The FullSession 2026 drop-off guide likewise treats the largest percentage drop as a starting signal rather than a complete priority rule.
Translate the pattern into a narrow change: repair one error state, clarify one setup action, or route one user goal differently. Pair behavior with interviews or surveys; Amplitude's product-survey guidance distinguishes behavioral analytics from the structured feedback used to understand user reasoning.
Comparison with an earlier cohort is observational unless the test controls other changes. Acquisition mix, product releases, assistance levels, and seasonal behavior may also explain the difference.
Consider a content workspace where the activation event is saving a usable draft. The supporting events are account creation, publishing-goal selection, template selection, and a later return to revise or create another draft.
Role, goal, and onboarding branch remain properties rather than separate events. The team can therefore compare solo founders with product marketers or educational-content paths with announcement paths without fragmenting the event taxonomy.
Observed pattern | Interpretation to test | Smallest useful next step |
|---|---|---|
Goal selected, but no usable draft saved | The first creation action may be unclear | Review affected sessions and test one starting structure |
Draft saved, but few users return | The event may not represent repeatable value | Interview activated non-returners |
One goal segment stalls | A blended average hides branch-specific friction | Inspect that branch before changing shared steps |
If announcement users repeatedly exit after choosing a template while educational-content users save drafts, the evidence supports inspecting the announcement path. It does not justify redesigning the entire editor.
Use onboarding analytics when users reach the product but the team cannot agree where qualified users stall or which change deserves priority.
Situation | Use analytics to answer |
|---|---|
Users enter but do not activate | Which transition blocks the activation event? |
Return behavior is weak | Does the chosen value event lead to repeat use? |
Segments follow different paths | Which role, goal, source, or branch behaves differently? |
Several fixes look plausible | Which problem has the strongest evidence and consequence? |
Use a meaningful return event as the downstream check. Mixpanel's retention documentation defines retention behavior as completing an initial event and later returning for another event.
For the broader signup-to-product transition, the activation-handoff guide covers the journey-design decision; analytics supplies evidence about that handoff.
Do not let onboarding analytics drive the decision when the sample is too small, event definitions keep changing, implementation is unreliable, or the team cannot yet name a credible activation event.
Amplitude's 2024 sample-size guidance explains that sample size affects precision and reliability, while smaller qualitative samples are better suited to detail and nuance. Low-volume teams should observe users directly instead of declaring a winner from a weak experiment.
Optimizely's low-traffic guidance recommends estimating required sample size and choosing tests carefully when traffic or conversion volume is limited.
Pause analytics-led optimization when:
I would rather watch users attempt the task and repair an obvious blocker than optimize a precise-looking but unreliable conversion rate.
FounderHQ can support the journey-design side of this workflow without replacing product analytics or founder judgment. Journeys supports quizzes, waitlists, onboarding flows, branching steps, hosted or embedded delivery, and answers stored as contact attributes for segmentation.
The useful connection is operational: a segment found in the data can inform a structured branch while the context behind the decision stays attached to the journey. The analytics system must still measure behavior, and no journey builder guarantees activation, retention, signups, revenue, or another business outcome.
Record the event definition, affected segment, evidence, chosen change, and review date in one decision note. A weekly signal log keeps the finding connected to the next product decision.
Start with one activation event, three to five supporting events, and one weekly question. If trustworthy behavioral and qualitative evidence identify the same blocker, change one part of the journey; if the evidence is weak, keep onboarding manual and observe users directly.
User onboarding metrics show whether new users progress from entry to meaningful product value. A lean set includes activation rate, time to first value, consequential step drop-off, onboarding completion, early retention, and repeated friction signals from interviews, support, surveys, or session reviews.
Activation rate is the percentage of eligible new users who complete a defined value-linked event within a set window. Calculate it as activated new users divided by eligible new users, multiplied by 100. Account creation or checklist completion is a weak substitute unless it reliably represents value.
Define the activation event, instrument three to five supporting events, and measure conversion and elapsed time between them. Add decision-relevant properties, compare relevant segments, and investigate the most consequential stall with user feedback before changing the experience.
Time to value is the elapsed time between a user's starting point—usually signup or the first session—and the event that demonstrates a meaningful product benefit. Interpret it within the product's natural usage cadence rather than applying the same deadline to daily and monthly products.
List the events from onboarding entry to activation, calculate conversion and elapsed time between adjacent events, and compare relevant segments or cohorts. Prioritize the stall that most directly blocks value, then use interviews, support questions, surveys, or session evidence to investigate why it occurs.
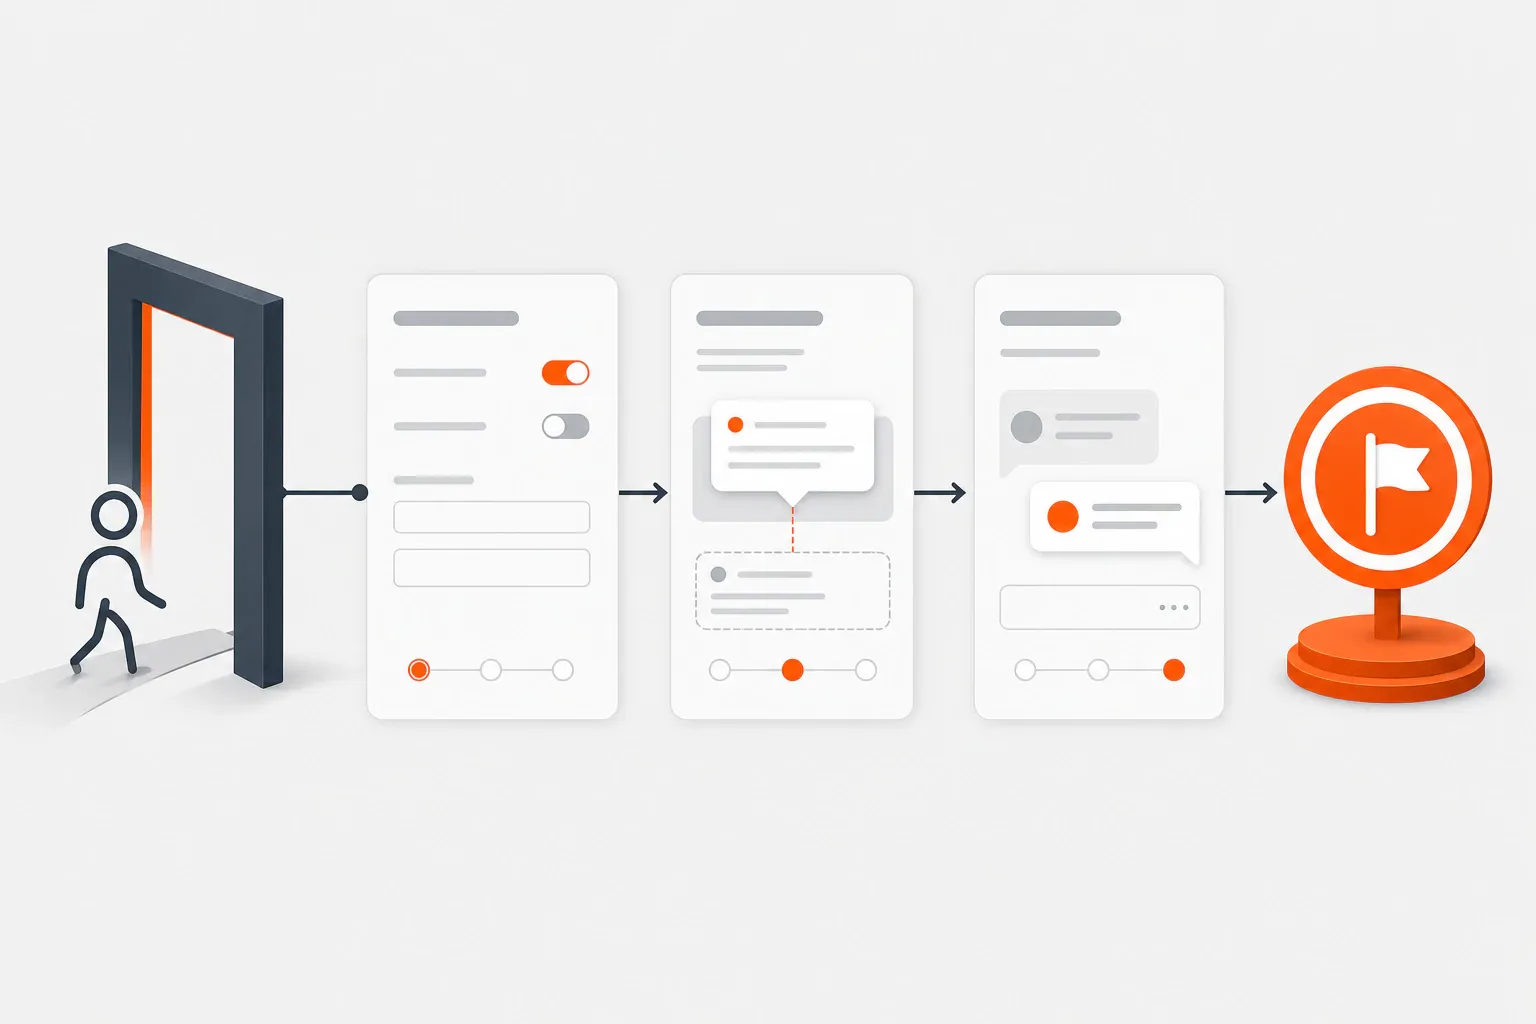
A practical seven-step application onboarding process for moving new users from signup to first meaningful value without unnecessary setup or generic tours.

In-app guidance helps users complete meaningful tasks inside a product. This guide explains the main patterns and how to match each one to an onboarding blocker.

FounderHQ at getfounderhq.com is a founder-controlled growth operating system for early-stage teams. This guide explains its connected workflows, alternatives, best-fit use case...
 FounderHQ